Population, Power, and Security: Demographic Pressures Shaping U.S.-China Strategic Competition (Volume 21, Issue 2)

Elderly Chinese men playing draughts. Source: Creative Commons
By Tahina Montoya, Kelly Atkinson, Kelly Piazza, Michael Pollard
Introduction
U.S.-China relations reflect an enduring strategic rivalry, with both sides viewing the other as a principal challenge to advancing their vital interests. [1] While this competition is often attributed to ideology, military power, and economics, demographics are an understated factor that increasingly shape its long-term trajectory. Population trends influence labor supply, economic growth, technological capacity, and military recruitment, which are all core foundations of national power.
Both the United States and China face demographic challenges rooted in different causes, which unfold along distinct trajectories. In China, decades of fertility control under the one-child policy accelerated population aging, contributed to a constrained labor force, and reinforced a significant gender imbalance. [2] China’s weak institutional capacity to support its population through unevenly distributed social service programs compounds challenges. [3] While China avoids framing its demographic pressures as a national crisis, the Chinese Communist Party’s (CCP) increasing emphasis on fertility-focused reforms suggests a growing recognition of their long-term economic and social implications. In the United States, fertility decline has been more gradual, but inconsistent immigration policy, rising dependency ratios, [4] and worsening population health pose risks to national security.
In this paper, the authors assess that demographic dynamics are already influencing the balance of U.S.-China competition and will continue to do so in the decades ahead. The paper advances a framework to examine how demographic changes shape long-term strategic competition and integrates key factors—including fertility decline, population aging, and labor force contraction—into a three-part framework of demographic composition, population health, and demographic power. Applying this framework demonstrates how similar demographic challenges manifest differently across the United States and China and highlights the strategic implications of these differences. This comparative analysis enables decisionmakers to evaluate the role demographics play in U.S.-China strategic competition and to consider policy options that preserve and expand U.S. strategic advantage.
Developing a Framework of Demographic Pressures
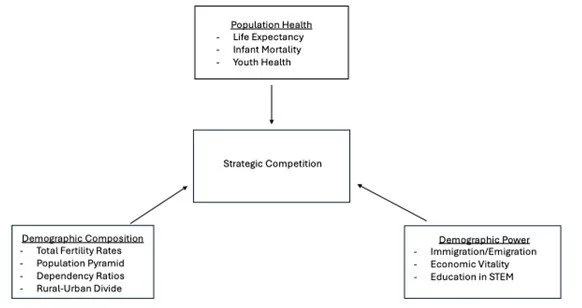
To develop a novel framework for assessing demographic pressures, this analysis draws on three key dimensions adapted from literature addressing political demography: [5] demographic composition, population health, and demographic power. Together, these dimensions capture distinct ways in which population dynamics shape national strength:
Demographic composition describes the structure of a population through indicators such as fertility rates, age distribution, dependency ratios, and the rural-urban divide. These factors influence the balance between working-age and dependent populations, the sustainability of labor and welfare systems, and long-term economic and strategic potential of a country.
Population health reflects the vitality and sustainability of a population. Indicators such as life expectancy, infant mortality, and youth health [6] highlight a society’s ability to maintain productive workforces and care for aging cohorts.
Demographic power captures how demographic trends are translated into national capacity. Immigration and emigration flows, economic vitality, and education in science, technology, engineering, and mathematics (STEM) determine whether demographic pressures result in resilience or weakness.
Figure 1 illustrates this framework, which provides a structured way to compare countries’ demographic trends and assess their implications for long-term strategic competition.
Applying the Framework of Demographic Pressures
Demographic Composition: Total Fertility Rates
To maintain population size across generations without immigration, a total fertility rate (TFR) of 2.1, known as the “replacement level,” is required. [7] Both the United States and China currently exhibit total fertility rates well below the replacement level of 2.1, as seen in Figure 2: since 2000, China’s total fertility rate has fallen to roughly 0.99—less than half of replacement—while U.S. fertility declined more gradually to about 1.62, with projections suggesting continued sub-replacement fertility in both countries. [8] Absent substantial immigration or major policy change, neither country is likely to achieve long-term population stability. [9] China’s sustained sub-replacement fertility has accelerated population aging and an inversion in age structure, with a shrinking working-age population supporting a rapidly expanding elderly cohort. [10]
Figure 2. Total Fertility Rate, China and the U.S.: 2000-2050

SOURCE: RAND analysis of United Nations World Population Prospects Data (World Bank, 2025).
Sustained low fertility can contribute to demographic, economic, and national security challenges. In China, persistent low fertility rates may intensify intergenerational burdens and the legacy of the 4-2-1 family structure. [11][12] In the United States, fertility decline may exacerbate constraints on military recruitment and defense workforce readiness. [13] Together, these demographic pressures may shape China’s approach to Taiwan in relation to U.S. capacity to sustain defense preparedness.
Demographic Composition: Population Pyramids
Population pyramids capture how low fertility rates translate into shrinking youth cohorts and shifting age distributions. As shown in Figure 3, China’s population in 2020 still reflected a large working-age cohort alongside a relatively small youth population and a growing elderly segment, signaling the end of its demographic dividend—a period of sustained economic growth supported by a large working-age population. By 2050, the population pyramid is projected to invert, with a distinctly smaller base, a reduced labor force, and a rapidly expanding elderly population. [14] This shift indicates accelerating population aging and rising dependency burdens that can increasingly constrain China’s economic and strategic capacity. [15]
Figure 3. Comparing Population Pyramids for China
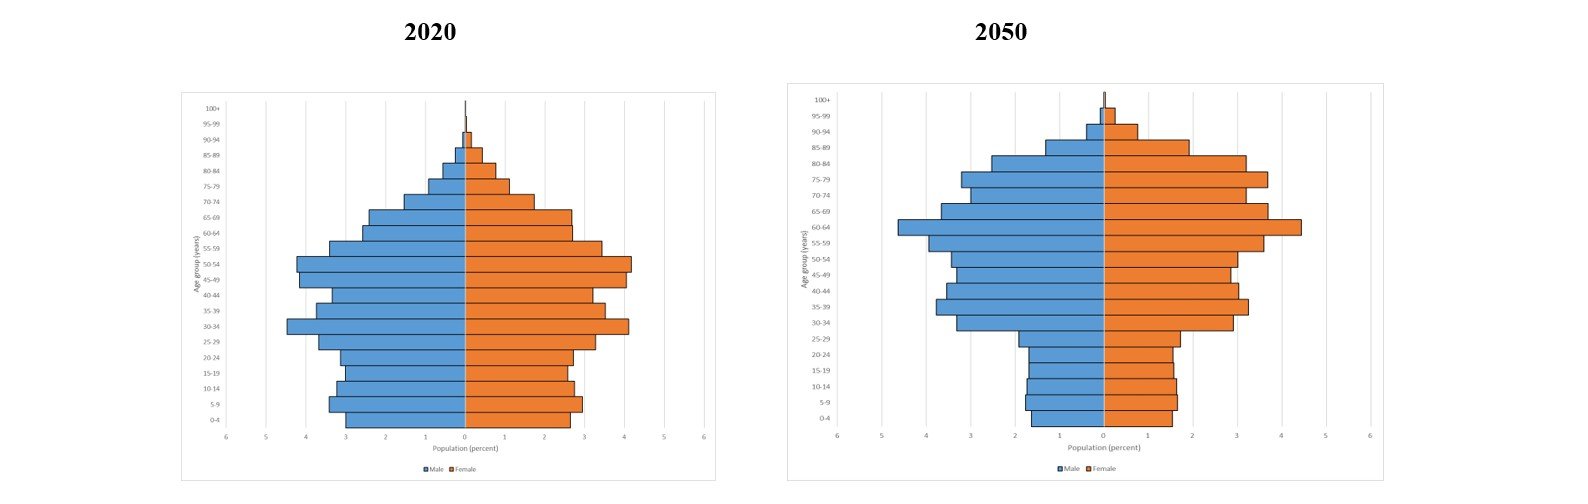
SOURCE: RAND analysis of United Nations World Population Prospects Data (World Bank, 2025).
In contrast, Figure 4 illustrates the United States’ comparatively stable age structure. The U.S. population pyramid remains broadly rectangular from 2020 through 2050, with only modest base narrowing and gradual expansion of older cohorts, reflecting a slower and more manageable aging trajectory.
Figure 4. Comparing Population Pyramids for the United States
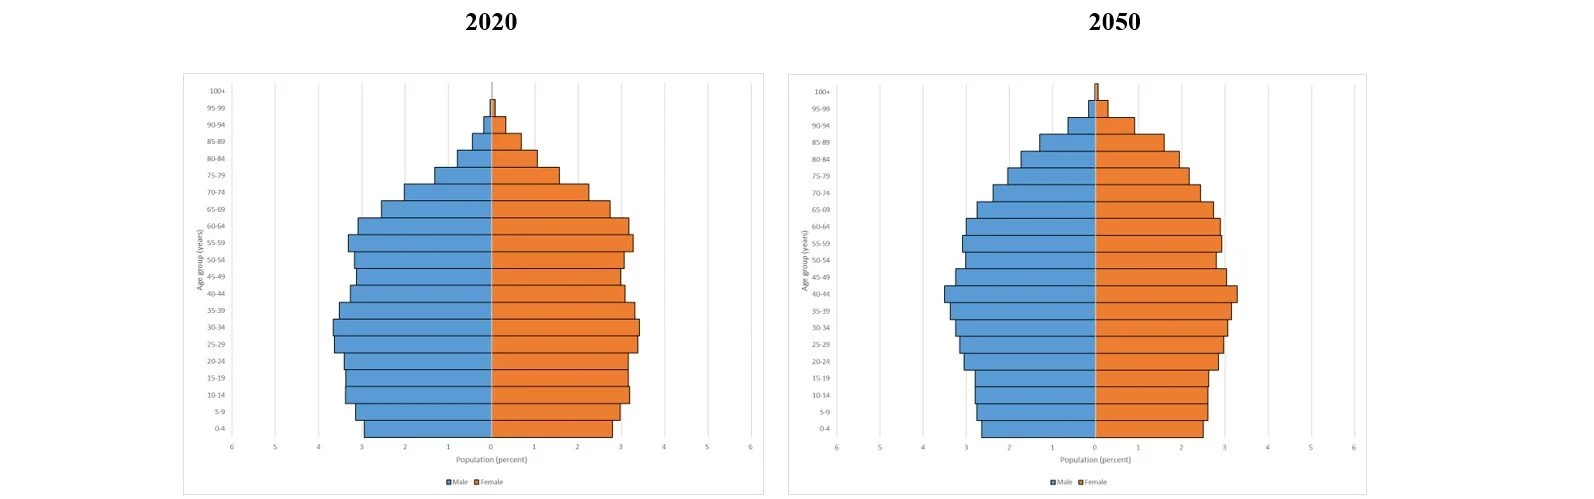
SOURCE: RAND analysis of United Nations World Population Prospects Data (World Bank, 2025).
Although the United States will also face rising dependency ratios, its demographic trajectory remains comparatively stable, while China is undergoing a sharper and more destabilizing demographic transformation.
Demographic Composition: Dependency Ratios
Figure 5 illustrates dependency ratios, capturing the balance between working-age populations and dependents. Higher ratios indicate increased economic and fiscal burdens as fewer workers support larger dependent populations.
Figure 5: China and U.S. Dependency Ratios Over Time
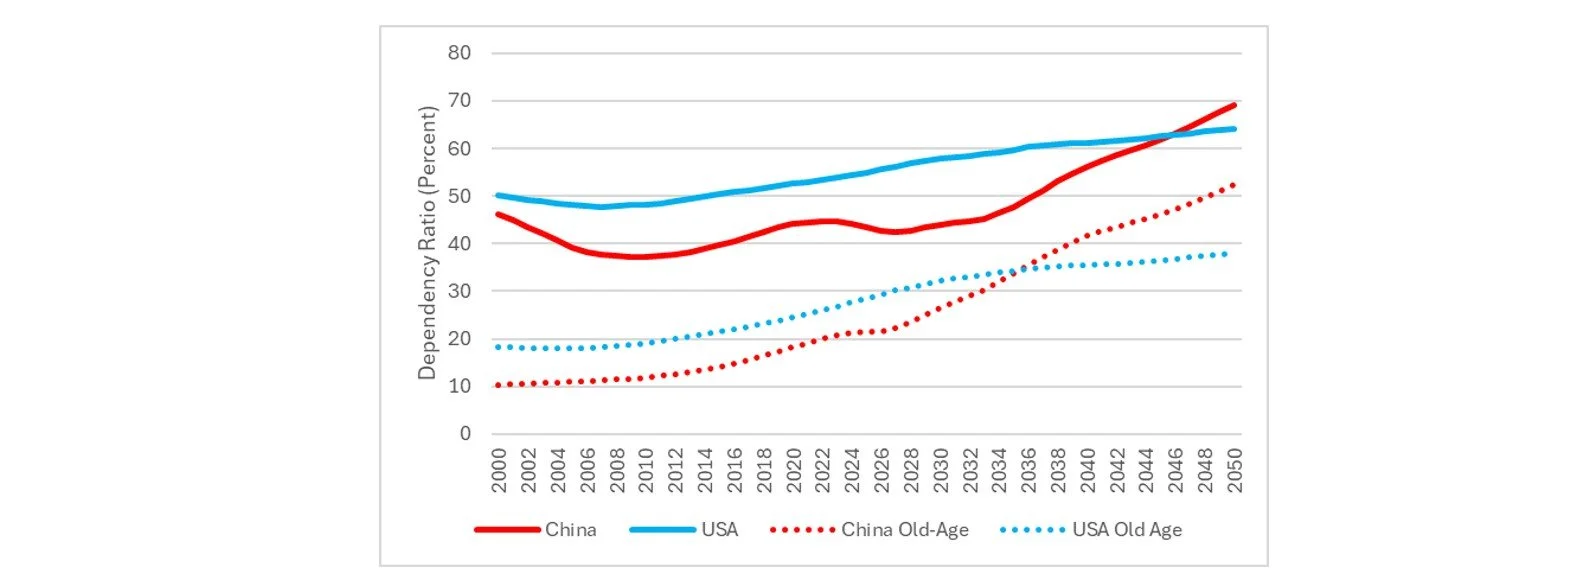
SOURCE: RAND analysis of United Nations World Population Prospects Data (World Bank, 2025).
Both China and the United States face rising dependency ratios, though the underlying dynamics and implications differ slightly. China is projected to lose hundreds of millions of workers, driving a rapid increase in dependency burdens, [16] while the U.S. labor force is projected to expand by roughly 13 percent between 2020 and 2050. [17][18] In China, rising dependency is driven primarily by rapid population aging and labor force contraction; in contrast, the United States experiences a more gradual increase shaped by longer lifespans and sustained population growth. As a result, while dependents in both countries may approach 70 percent of the working-age population, similar ratios mask different realities. One is driven by contraction and rapid aging, the other by slower, more balanced demographic change.
In China, underdeveloped social safety nets and limited eldercare capacity can heighten fiscal and social stress, potentially increasing the likelihood that resources will be diverted away from defense, education, and international engagement. [19] These pressures may prompt Beijing to prioritize foreign investments with direct domestic economic or technological returns over broader diplomatic outreach. [20] In the United States, aging poses a less severe but still meaningful challenge, potentially increasing pressure on Social Security, healthcare, and military recruitment. [21]
Taken together, rising dependency ratios are likely to constrain both countries’ strategic capacity, but more acutely in China where fiscal pressures threaten to outpace adaptation. The United States retains greater room to adjust, provided it addresses demographic risks before they intensify. [22]
Demographic Composition: Urbanization
Urbanization trends highlight differences in how China and the United States manage demographic pressures. China’s urbanization has risen rapidly since 2000 and is projected to continue increasing, though satellite-based measures suggest urban growth may be nearing saturation and that rural populations are disproportionately older. [23] The United States, by contrast, reached high levels of urbanization earlier and is projected to experience only gradual additional urban growth. [24]
While both countries face urban–rural disparities in health, wealth, and access to services, [25] China’s challenges are magnified by the hukou system, [26] which restricts labor mobility and access to social services. [27] In the United States, rural populations are generally older and less healthy, but do not face comparable institutional barriers. [28] As a result, urban–rural inequalities pose a more acute constraint on China’s labor supply, social stability, and state capacity, while in the United States they primarily risk exacerbating labor shortages, regional disparities, and pressures on local health systems.
Population Health: Life Expectancy
Life expectancy trends reveal divergent population trajectories in China and the United States. China has achieved rapid gains in life expectancy since 1950 and is projected to surpass eighty-three years by 2050, while U.S. life expectancy has grown more slowly and is now projected to gradually converge with China’s rising trajectory. [29] As of 2023, U.S. life expectancy trails that of other high-income countries by more than two years, signaling mounting vulnerabilities for workforce resilience and national security. [30] Although national averages obscure persistent rural disadvantages in China, [31] we assess that China’s steady gains are strengthening its population health profile, while U.S. stagnation underscores mounting vulnerabilities, including risks to workforce resilience, rising health costs, and broader national security.
Population Health: Infant Mortality Rates
Infant mortality rates are now broadly comparable in China and the United States at roughly five deaths per 1,000 live births, but underlying trajectories differ sharply. [32] China has reduced infant mortality by nearly 85 percent since 2000, while U.S. progress has been modest and remains among the weakest in the Organisation for Economic Co-operation and Development (OECD), highlighting a widening gap in progress and relative performance despite similar current rates.
Population Health: Disability-Adjusted Life Years
Disability-Adjusted Life Years (DALYs) highlight stark differences in overall disease burden between China and the United States. In 2021, DALYs per 100,000 people were substantially higher in the United States than in China despite far greater U.S. health spending. [33] While China’s lower average disease burden masks significant urban–rural disparities, [34] persistently poor U.S. health outcomes may erode its demographic advantage and pose risks to workforce resilience and military readiness, particularly with declining youth fitness and eligibility to serve. [35]
Demographic Power: Immigration/Emigration
Figure 6 illustrates net international migration trends, highlighting a stark contrast between the United States and China. Since 1980, China has experienced consistently negligible net international migration, while the United States has sustained positive—though fluctuating—levels of net migration, underscoring immigration’s role in offsetting U.S. demographic pressures. [36]
Figure 6: U.S. and China Net International Migration and Natural Change
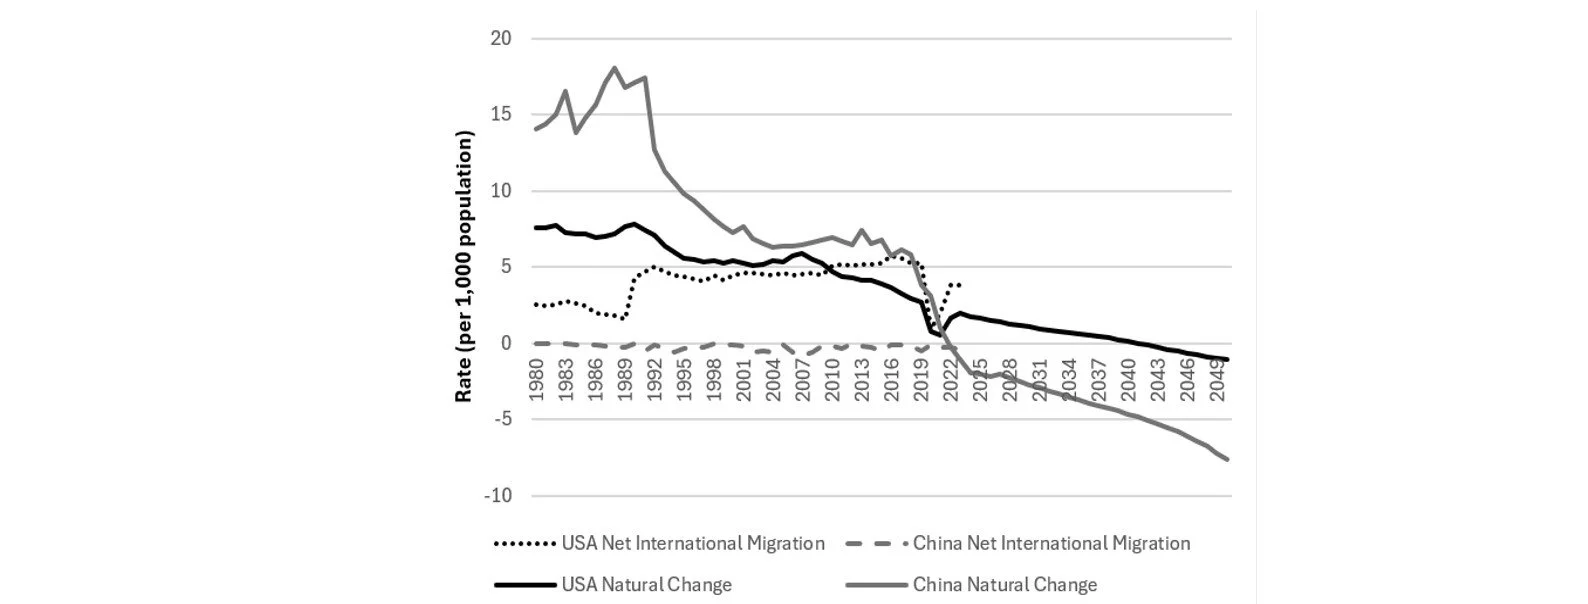
SOURCE: RAND analysis of United Nations World Population Prospects Data (World Bank, 2025).
Immigration provides the United States with a significant demographic advantage by sustaining labor force growth and mitigating the effects of low fertility and aging. [37] Absent immigration, U.S. population growth would already be negative, [38] while China’s lack of immigration inflows has accelerated its demographic decline. The U.S. advantage, however, is contingent on consistent immigration policy; polarization or restrictive shifts could quickly erode immigration’s stabilizing role.
Demographic Power: Economic Vitality
While the relationship between population dynamics and economic growth is complex, research shows that demographic trends shape per capita output in ways conditioned by age structure and country-specific factors. [39] In China, historical evidence suggests that population size exerted a negative effect on GDP per capita, while savings, industrialization, and technological change were more important drivers of growth. [40] More recent analyses indicate that demographic aging and slowing capital accumulation are likely to dampen growth further, with excess savings becoming a constraint rather than a driver. [41]
Overall, population aging is expected to slow growth in both China and the United States, though more sharply in China. While innovation and structural change can mitigate labor-force decline, [42] empirical evidence from OECD economies links aging to productivity slowdowns. [43] In the United States, aging has already reduced GDP per capita growth and is projected to exert increasing downward pressure as the share of the population over age sixty continues to rise. [44] China’s demographic headwinds are likely to be stronger, given the speed and scale of its aging trajectory. These constraints are already influencing China’s external economic behavior. As population aging reduces China’s lifecycle surplus and increases domestic fiscal pressures, the pool of resources available for external investment is likely to tighten. [45] Consistent with this shift, China has moved toward more selective overseas lending and a greater emphasis on foreign investments with clearer economic or strategic return, including a recalibration of Belt and Road activities. [46]
Demographic Power: STEM Education
STEM education serves as a key component of demographic power by shaping a country’s ability to translate population size into innovation and productivity. [47] China has dramatically expanded access to tertiary education since 2000, resulting in a much larger pipeline of STEM graduates than the United States. [48] China now outpaces the United States across multiple STEM indicators, including doctoral output and overall scale of research institutions. [49]
Enrollment figures, however, mask important quality differences. China’s higher-education system is uneven, with elite institutions producing world-class talent alongside many programs of lower quality. [50] The United States, while facing challenges of access and scale, continues to maintain a concentration of high-quality institutions that attract global talent. [51]
China’s sustained investment in STEM education—initiated during the one-child policy era—may reflect a deliberate strategy to offset demographic decline and limited immigration by boosting innovation, economic growth, and military modernization. [52] These investments could strengthen China’s long-term competitiveness, while the United States risks a widening gap unless it reinforces STEM education and innovation capacity.
Assessing National Security Implications from Demographic Pressures
Demographic pressures pose growing risks to U.S. national security, and China’s experience offers important lessons for anticipating and mitigating similar challenges. In China, demographic decline has already reshaped domestic priorities, driving pronatalist policies, reforms to the hukou system, and increased investment in education and technology. The United States currently benefits from a more favorable demographic position—supported by slower aging, moderately higher fertility, and an immigration-driven workforce. We summarize key comparative insights from demographic pressures in Table 1.
Table 1. Comparing U.S.-China Demographic Pressures [53]
| Demographic Pressure Category | Indicator | China (2000 → Most Recent) | U.S. (2000 → Most Recent) | Key Takeaway |
|---|---|---|---|---|
| Demographic Composition | Total Fertility Rate (TFR) | 1.63 → 0.99 (2023) Legacy of One-Child Policy and fertility below replacement since 1991 | 2.03 → 1.62 (2023) Fertility below replacement since 2008 |
|
| Demographic Composition | Aging Population | Rapid aging, insufficient social safety net | More gradual aging, fiscal strain on social security programs |
|
| Demographic Composition | Urbanization (percent urban) | Rapid urbanization (35.9 → 66.5) (2025) Hukou system exacerbating barriers | Gradual and less disruptive urbanization (79.1 → 83.7) (2025) |
|
| Demographic Composition | Total/Old-Age Dependency Ratios | 46.1 → 43.5 (2025) (Total) 10.3 → 21.4 (2025) (Old Age) |
50.0 → 55.0 (2025) (Total) 18.3 → 28.5 (2024) (Old Age) |
|
| Population Health | Life Expectancy (years) | (72.3 → 78) | (76.8 → 79.3) |
|
| Population Health | Infant Mortality (per 1,000 live births) and DALYS | Steep decline in infant mortality rate (27.9 → 5.1) | Gradual decline in infant mortality rate (7.2 → 5.3) |
|
| Population Health | Overall and Youth Health / DALYs | Lower health burden despite rapid aging | Higher health burden despite greater healthcare spending |
|
| Demographic Power | Immigration / Emigration (per 1,000 pop.) | Homogenous society with minimal net international immigration (-0.03 percent net outflow) | Population growth sustained primarily by immigration (+ 0.4 percent net inflow) |
|
| Demographic Power | Labor Force & Economy | Risk of "Middle Income Trap" | Labor gaps at high and low skill levels |
|
| Demographic Power | Education Accessibility and Emphasis on STEM (graduates) | Dramatic increase in: Tertiary education enrollment (7.6 → 53.8 percent) (2019) STEM PhDs (7,766 → 39,768) (2018) |
Steady increase in: Tertiary education enrollment (67.8 → 88.3 percent) (2018) STEM PhDs (26,086 → 41,071) (2018) |
|
Demographic Composition Implications
China’s demographic composition is shifting rapidly as declining fertility, workforce contraction, and population aging place growing demands on state resources. Although these trends are unlikely to significantly affect People’s Liberation Army (PLA) personnel levels or combat readiness in the near-term given China’s modest recruitment needs and large pool of unemployed youth, [54] they will necessitate resource reallocation toward social welfare and eldercare, potentially constraining China’s capacity to project power globally. These pressures may also generate short-term strategic risks if Beijing acts before demographic constraints deepen, potentially accelerating timelines for externally focused priorities such as Taiwan.
Evidence suggests that demographic and fiscal pressures are already influencing China’s external behavior. Recent analysis indicates that, as demographic aging and slowing capital accumulation dampen China’s growth, Beijing has recalibrated aspects of its Belt and Road Initiative, scaling back large infrastructure projects in favor of smaller, commercially viable investments and redirecting resources toward domestic economic stabilization. [55] Such shifts highlight a growing prioritization of initiatives with direct domestic or strategic returns, including those tied to economic resilience and geopolitical positioning, over expansive global influence. These dynamics may create opportunities for the United States to reduce Chinese leverage in key regions and strengthen security partnerships while also underscoring the need for preparedness should China accelerate its approach toward Taiwan.
To manage these risks, U.S. policymakers should integrate demographic indicators into interagency assessments of China’s strategic behavior, drawing on analytic frameworks within the National Intelligence Council and the Department of State’s Bureau of Intelligence and Research to provide early warning of shifts in resource allocation or foreign policy priorities. [56]
At the same time, the United States must address its own demographic constraints. Persistently low fertility and rising old-age dependency may place increasing pressure on the workforce, with immigration projected to become the sole driver of U.S. population growth after 2033. [57] Sustaining a coherent and consistent immigration policy will be essential to maintaining labor supply, supporting critical sectors, and preserving long-term economic and security readiness.
Population Health Implications
China’s strained social systems, gender imbalance, and widening rural–urban divide are likely to accelerate demographic decline and increasingly shape the CCP’s prioritization of domestic stability relative to long-term international ambitions. For U.S. policymakers, monitoring these demographic stressors can help identify when internal pressures may begin to constrain China’s external behavior or influence its risk tolerance, creating opportunities to shape competitive strategy.
Integrating demographic indicators into interagency intelligence assessments and futures analysis—such as those conducted through National Intelligence Council assessments and Department of War analytic initiatives—can improve early warning of potential inflection points in China’s external posture. [58] Such analysis could inform U.S. defense posture, economic policy, and diplomatic engagement, including efforts to counter or capitalize on shifts in China’s overseas investment as demographic and labor pressures mount. [59]
At the same time, the United States faces its own demographic health challenges. Declining youth fitness and a shrinking pool of medically eligible recruits, combined with low military propensity to serve, may pose near-term readiness risks, while population aging continues to strain social security, healthcare, and veterans’ systems. [60] Sustaining U.S. national power will therefore require proactive investment in population health, workforce readiness, and eldercare — such as strengthening preventive healthcare, improving youth fitness and workforce training, and expanding sustainable childcare and eldercare systems— to mitigate long-term economic and defense pressures.
Demographic Power Implications
Demographic power shapes national resilience and strategic influence by determining how effectively states convert population characteristics into economic and technological capacity. In China, internal stratification reinforced by the hukou system constrains labor mobility and limits the country’s ability to offset population aging and workforce shortages, helping explain Beijing’s growing reliance on automation, artificial intelligence, and advanced technologies to sustain productivity and growth. [61] While these investments may partially mitigate demographic decline, they also reflect structural constraints that could limit China’s long-term competitiveness.
By contrast, the United States retains a significant demographic advantage through immigration, which can sustain workforce growth and innovation even amid low fertility and population aging. This advantage, however, depends on consistent and well-managed immigration policy. Polarization or restrictive shifts risk eroding U.S. demographic resilience and narrowing the United States’ existing strategic demographic advantage over China.
Conclusion
Demographic dynamics shape national security through three interrelated dimensions—composition, health, and power—and provide valuable insight into the trajectory of strategic competition. For U.S. policymakers, assessing China’s demographic challenges can inform evaluations of Beijing’s long-term defense spending, military readiness, and global influence, particularly as aging and labor contraction constrain internal capacity. [62] For example, China’s growing emphasis on social stability and domestic welfare spending may further limit its ability to sustain overseas initiatives or prolonged military operations, including elements of the Belt and Road Initiative. [63] At the same time, tracking investments in artificial intelligence and STEM education can help identify areas of intensified competition or potential U.S. advantage. [64]
As demographic pressures intensify, China’s ability to sustain simultaneous investments in domestic social programs and global influence is likely to diminish, forcing clearer tradeoffs that could reshape its foreign policy trajectory. [65] Monitoring these adjustments, while remaining attentive to U.S. demographic vulnerabilities, can help policymakers leverage demographic insights to preserve strategic advantage. Although immigration is a critical pillar of U.S. demographic resilience, long-term strength ultimately rests on broader adaptability through innovation, education, and responsive governance. Institutionalizing demographic analysis within U.S. strategic forecasting, intelligence, and defense-planning frameworks—such as those led by the National Intelligence Council and the Department of War—can strengthen the government’s ability to anticipate how population trends shape China’s global capacity and inform U.S. policy responses.
About the author
Tahina Montoya is a policy researcher, an adjunct professor at George Washington University and the Inter-American Defense College, and a Presidential Leadership Scholar. She conducts research on issues of national security policy and international affairs, with a focus on security cooperation and human security. Dr. Montoya holds a PhD in liberal studies with a certificate in gender, peace and security from Georgetown University.
Kelly Atkinson is a political scientist and a Term Member at the Council on Foreign Relations. She conducts research on issues of military personnel policy, international security, and human security. Dr. Atkinson holds a PhD in political science and women’s studies from the Ohio State University.
Kelly Piazza is a political scientist, a lecturer at Johns Hopkins University, and a Term Member at the Council on Foreign Relations. She conducts mixed-methods research on strategic competition, U.S. foreign policy, and demographic quality and stability. Dr. Piazza holds a PhD in political science from the University of Illinois at Urbana-Champaign.
Michael Pollard is a sociologist and a professor of demography. He conducts research on social networks and health (physical, mental, and health behaviors), demography, and public perceptions. Dr. Pollard holds a PhD in sociology from Duke University.
Endnotes
[1] Theresa Hitchens, “Strategic Competition,” Journal of Indo-Pacific Affairs, December 15, 2020, https://www.airuniversity.af.edu/JIPA/Display/Article/2425084/strategic-competition/.
[2] Michael S. Pollard, Jennifer Bouey, Agnes Xiangzhen Wang, and Rakesh Pandey, “Fertility Decline in China and Its National Military, Structural, and Regime Security” RAND Corporation, 2025.
[3] Kelly Atkinson, Tahina Montoya, Michael S. Pollard, Libby Weaver, Flora Sheng, Kelly Piazza, and Agnes Xiangzhen Wang, “Pronatalist Pivot—Assessing China’s Policy Efforts to Boost Fertility,” RAND Corporation, 2025.
[4] Dependency ratios measure the balance between the working-age population and those typically considered dependents, such as children and older adults. Higher ratios indicate that fewer workers are supporting a larger dependent population.
[5] Yao Lu, “Political Demography: The Political Consequences of Structural Population Change,” Annual Review of Sociology 50, no. 1, 2024, pp. 101–123.
[6] Youth health refers to the physical, mental, and developmental well-being of children and adolescents, as reflected in indicators such as nutrition, obesity, disease burden, fitness, and access to care, which together influence future workforce, resilience, military eligibility, and long-term demographic sustainability.
[7] World Bank, “World Development Indicators: Gross Enrollment Ratio, Tertiary (China),” accessed September 30, 2025, https://data.worldbank.org/indicator/SE.TER.ENRR?locations=CN.
[8] World Bank, “World Development Indicators: Gross Enrollment Ratio, Tertiary (China),” accessed September 30, 2025, https://data.worldbank.org/indicator/SE.TER.ENRR?locations=CN;
United Nations Department of Economic and Social Affairs, Population Division, “World Population Prospects,” accessed September 24, 2025, https://population.un.org/wpp/.
[9] Pew Research Center, “Key Findings About U.S. Immigrants,” August 20, 2024, accessed September 30, 2025, https://www.pewresearch.org/short-reads/2025/08/21/key-findings-about-us-immigrants/.
[10] Pollard et.al, “Fertility Decline in China.”
[11] The 4-2-1 family structure refers to a household pattern that emerged in China during the one-child policy era, where one child is responsible for supporting two parents and four grandparents. As the population ages and family sizes remain small, this structure places increasing financial and caregiving pressure on the working-age generation. Over time, it has raised concerns about eldercare, workforce strain, and broader economic sustainability.
[12] Quanbao Jiang and JJ Sánchez-Barricarte, “The 4-2-1 Family Structure in China: A Survival Analysis Based on Life Tables,” European Journal of Ageing 8, no. 2, 2011, pp. 135–147; Pollard et.al, “Fertility Decline in China.”
[13] Beth Asch, “Navigating a Changing Military Recruitment Environment,” RAND Corporation, Commentary, April 8, 2025, accessed September 24, 2025, https://www.rand.org/pubs/commentary/2025/04/navigating-a-changing-military-recruitment-environment.html; Michael G. Mattock and Beth J. Asch, “The Dynamic Retention Model: Theory, Estimates, Innovations, and Extensions” RAND Corporation, 2023, https://www.rand.org/pubs/research_reports/RRA2581-1.html.
[14] Feng Wang, Ke Shen, and Yong Cai, “When the Abundance Ends: Economic Transformation, Population Aging, and Shrinking Lifecycle Surplus in China,” The Journal of the Economics of Ageing, pp. 30 (2025).
[15] Strategic capacity refers to a state’s ability to mobilize economic, technological, and human resources to pursue and sustain its national security and foreign policy objectives.
[16] Spencer Feingold, “The ‘Middle Income Trap’ Is Holding Back Over 100 Countries. Here’s How to Overcome It,” World Economic Forum, September 4, 2024, https://www.weforum.org/stories/2024/09/middle income trap world bank economic development/.
[17] René Böheim, Thomas Horvath, Thomas Leoni, and Martin Spielauer, “The Impact of Health and Education on Labor Force Participation in Aging Societies: Projections for the United States and Germany from Dynamic Microsimulations,” Population Research and Policy Review 42, no. 3, 2023, pp. 395–423.
[18] While this analysis focuses on structural demographic trends, labor force outcomes are also shaped by factors such as participation rates, retirement age, gender participation patterns, and broader socioeconomic conditions
[19] Toshihiko Horiuchi, Naohiro Ogawa, and Rikiya Matsukura, “Trends of Population Aging in East and Southeast Asia: The 2022 Update,” BioScience Trends 16, no. 2, 2022, pp. 85–97.
[20] Observer Research Foundation, “China’s Belt and Road Initiative in a Changing World: Trends, Challenges, and Recalibration,” Observer Research Foundation, 2025, accessed October 8, 2025, https://www.orfonline.org/public/uploads/posts/pdf/20250908154859.pdf; World Bank, “World Development Indicators: Gross Enrollment Ratio, Tertiary.”
[21] Charles H. Jones and Mikael Dolsten, “Healthcare on the Brink: Navigating the Challenges of an Aging Society in the United States,” npj Aging 10, no. 1, 2024.
[22] Pollard et.al, “Fertility Decline in China;”Congressional Budget Office, “The Demographic Outlook: 2025 to 2055,” 2025, accessed August 19, 2025, https://www.cbo.gov/system/files/2025-01/60875-demographic-outlook.pdf.
[23] United Nations, “World Population Prospects;” Global Human Settlement Layer, “Country Fact Sheets Based on the Degree of Urbanisation,” European Union, Copernicus, and Emergency Management Service, n.d., accessed September 8, 2025, https://ghsl.jrc.ec.europa.eu/CFS.php.
[24] United Nations, “World Population Prospects.”
[25] Leah R. Abrams, Mikko Myrskylä, and Neil K. Mehta, “The Growing Rural–Urban Divide in US Life Expectancy: Contribution of Cardiovascular Disease and Other Major Causes of Death,” International Journal of Epidemiology 50, no. 6, 2021, pp. 1449–1459; Steven A. Cohen and Mary L. Greaney, “Aging in Rural Communities,” Current Epidemiology Reports 10, no. 1, 2023, pp. 21–30.
[26] The hukou system is China’s household registration system that ties access to public services and benefits to a person’s registered location, creating barriers for many rural migrants seeking work and services in urban areas.
[27] Chenmeng Guo, Weiqi Zhou, Chuanbao Jing, and Dawa Zhaxi, “Mapping and Measuring Urban-Rural Inequalities in Accessibility to Social Infrastructures,” Geography and Sustainability 5, no. 1, 2024, pp. 1–12.
[28] Daniel T. Lichter and David L. Brown, “Rural America in an Urban Society: Changing Spatial and Social Boundaries,” Annual Review of Sociology 37, no. 1, 2011, pp. 565–592.
[29] United Nations, “World Population Prospects.”
[30] Ibid.
[31] Scott Rozelle and Natalie Hell, Invisible China: How the Urban–Rural Divide Threatens China’s Rise (Chicago: University of Chicago Press, 2020).
[32] United Nations, “World Population Prospects.”
[33] Institute for Health Metrics and Evaluation, “Global Health Data Exchange (GHDx),” accessed September 24, 2025, http://ghdx.healthdata.org.
[34] Rozelle and Hell, Invisible China.
[35] Jones and Dolsten, “Healthcare on the Brink.”
[36] Brian Nichiporuk, “The Security Dynamics of Demographic Factors,” RAND Corporation, accessed September 24, 2025, https://www.rand.org/pubs/monograph_reports/MR1088.html; United Nations, “World Population Prospects.”
[37] Nichiporuk, “The Security Dynamics of Demographic Factors.”
[38] Justice Antonioli and Jack Malde, “The Demographic Transition: An Overview of America’s Aging Population and Immigration’s Mediating Role” Bipartisan Policy Center, accessed August 19, 2025, https://bipartisanpolicy.org/download/?file=/wp-content/uploads/2023/09/BPC_LIT-Review.pdf.
[39] Derek D. Heady and Andrew Hodge, “The Effect of Population Growth on Economic Growth: A Meta-Regression Analysis of the Macro-Economic Literature,” Population and Development Review, Vol. 35, 2009; W. Wesley F. Peterson, “The Role of Population in Economic Growth,” SAGE Open, October–December 2017.
[40] Wanjun Yao, Tomoko Kinusasa, and Shigeyuki Hamori, “An Empirical Analysis of the Relationship Between Economic Development and Population Growth in China,” Applied Economics 45, no. 33, 2013, pp. 4121–4131.
[41] Kyoji Fukao and Tangjun Yuan, “China’s Growth Slowdown: Lessons from Japan’s Experience and the Expected Impact on Japan, the USA and Germany,” China & World Economy 24, no. 5, 2016, pp. 1–29; Martin DeLuca and Roberto B. Pinheiro, “Excess Savings and Consumer Behavior: Excess Compared to What?” Economic Commentary, no. 2023-19, 2023.
[42] Maxime Fougère, Simon Harvey, Jacques Mercenier, and Marcel Mérette, “Population Ageing, Time Allocation and Human Capital: A General Equilibrium Analysis for Canada,” Economic Modelling 26, no. 1, 2009, pp. 30–45; Daron Acemoglu and Pascual Restrepo, “Secular Stagnation? The Effect of Aging on Economic Growth in the Age of Automation,” American Economic Review 107, no. 5, 2017, pp. 174–179.
[43] Yunus Aksoy, Henri S. Basso, Ron P. Smith, and Tobias Grasl, “Demographic Structure and Macroeconomic Trends,” American Economic Journal: Macroeconomics 11, no. 1, 2019, pp. 193–222; Nicole Maestas, Kathleen J. Mullen, and David Powell, “The Effect of Population Aging on Economic Growth, the Labor Force, and Productivity,” American Economic Journal: Macroeconomics 15, no. 2, 2023, pp. 306–341.
[44] Nicole Maestas, Kathleen J. Mullen, and David Powell, “The Effect of Population Aging on Economic Growth, the Labor Force, and Productivity,” American Economic Journal: Macroeconomics 15, no. 2, 2023, pp. 306–341.
[45] Wang, Shen, and Cai, “When the Abundance Ends,” p. 30.
[46] Observer Research Foundation, “China’s Belt and Road Initiative in a Changing World: Trends, Challenges, and Recalibration,” Observer Research Foundation, accessed October 8, 2025, https://www.orfonline.org/public/uploads/posts/pdf/20250908154859.pdf.
[47] While this section references STEM education as an indicator of innovation capacity, broader economic productivity and growth derive from a range of sectors, including manufacturing, services, agriculture, and finance.
[48] World Bank, “World Development Indicators: Gross Enrollment Ratio, Tertiary;” Center for Security and Emerging Technology, “China Is Fast Outpacing U.S. STEM PhD Growth,” Georgetown University, February 2021, accessed September 9, 2025, https://cset.georgetown.edu/publication/china-is-fast-outpacing-u-s-stem-phd-growth/; National Science Board, “International Comparisons of S&E Higher Education,” Science and Engineering Indicators 2022, National Center for Science and Engineering Statistics, 2023, https://ncses.nsf.gov/pubs/nsb202332/international-comparisons-of-s-e-higher-education.
[49] Global Policy Institute, “China Beats America in STEM Education,” accessed September 9, 2025, https://globalpi.org/research/china-beats-america-in-stem-education/;Center for Excellence in Education, “Index of Excellence in STEM Education Compares U.S. Students to Global Competition,” March 4, 2015, https://www.cee.org/newsevents/press-releases/index-excellence-stem-education-compares-us-students-global-competition.
[50] Weiyan Xiong, Jiale Yang, and Wenqin Shen, “Higher Education Reform in China: A Comprehensive Review of Policymaking, Implementation, and Outcomes Since 1978,” China Economic Review 72, 2022, https://doi.org/10.1016/j.chieco.2022.101752.
[51] National Research Council, “Research Universities and the Future of America: Ten Breakthrough Actions Vital to Our Nation’s Prosperity and Security” National Academies Press, 2012, https://doi.org/10.17226/13396.
[52] HongYong Hu, “Development of STEM Education in China,” in Proceedings of the 2nd International Conference on Education, Humanities, and Management (ICM 2023) (Paris: Atlantis Press, 2023).
[53] United Nations Department of Economic and Social Affairs, Population Division, “World Population Prospects,” accessed September 24, 2025, https://population.un.org/wpp/; World Bank, “Fertility Rate, Total (Births per Woman) – China,” accessed August 12, 2025, https://data.worldbank.org/indicator/SP.DYN.TFRT.IN?locations=CN; World Bank, “World Development Indicators: Gross Enrollment Ratio, Tertiary (China),” accessed September 30, 2025, https://data.worldbank.org/indicator/SE.TER.ENRR?locations=CN; National Center for Education Statistics, “College Enrollment Rates,” U.S. Department of Education, accessed September 29, 2025, https://nces.ed.gov/programs/coe/indicator/cpb; National Science Board, “International Comparisons of S&E Higher Education, Science and Engineering Indicators 2022,” NSB-2023-32, accessed September 9, 2025, https://ncses.nsf.gov/pubs/nsb202332/international-comparisons-of-s-e-higher-education; Center for Security and Emerging Technology, “China Is Fast Outpacing U.S. STEM PhD Growth,” February 2021, https://cset.georgetown.edu/publication/china-is-fast-outpacing-u-s-stem-phd-growth/; Center for Excellence in Education, “Index of Excellence in STEM Education Compares U.S. Students to Global Competition,” press release, March 4, 2015, accessed September 9, 2025, https://www.cee.org/newsevents/press-releases/index-excellence-stem-education-compares-us-students-global-competition; Global Human Settlement Layer, “Country Fact Sheets Based on the Degree of Urbanisation,” European Union, Copernicus Emergency Management Service, accessed September 8, 2025, https://ghsl.jrc.ec.europa.eu/CFS.php; Institute for Health Metrics and Evaluation, “Global Health Data Exchange (GHDx),” Institute for Health Metrics and Evaluation, accessed September 24, 2025, http://ghdx.healthdata.org.
[54] Mark Cozad and Jennie W. Wenger, “Factors Shaping the Future of China's Military,” RAND Corporation, 2025, https://www.rand.org/pubs/research_reports/RRA2618-1.html.
[55] Observer Research Foundation, “China’s Belt and Road Initiative in a Changing World: Trends, Challenges, and Recalibration,” Observer Research Foundation, 2025, accessed October 8, 2025, pp. 12-13, https://www.orfonline.org/public/uploads/posts/pdf/20250908154859.pdf.
[56] National Intelligence Council, “Global Trends 2040: A More Contested World,” Office of the Director of National Intelligence, 2021, accessed October 8, 2025, https://www.dni.gov/files/ODNI/documents/assessments/GlobalTrends_2040.pdf; U.S. Department of State, “Key Topics – Bureau of Intelligence and Research,” accessed October 8, 2025, https://www.state.gov/key-topics-bureau-of-intelligence-and-research/.
[57] Congressional Budget Office, “The Demographic Outlook: 2025 to 2055,” 2025, accessed August 19, 2025, https://www.cbo.gov/system/files/2025-01/60875-demographic-outlook.pdf.
[58] National Intelligence Council, “Global Trends 2040;” U.S. Department of Defense, “DoD Publications and Reports Portal,” accessed October 10, 2025, https://www.defense.gov/News/Publications/.
[59] Observer Research Foundation, “China’s Belt and Road Initiative in a Changing World: Trends, Challenges, and Recalibration,” Observer Research Foundation, 2025, accessed October 8, 2025, https://www.orfonline.org/public/uploads/posts/pdf/20250908154859.pdf.
[60] Jones and Dolsten, “Healthcare on the Brink.”
[61] Hu, “Development of STEM Education in China.”
[62] Wang, Shen, and Cai, “When the Abundance Ends,” p. 30; Toshihiko Horiuchi, Naohiro Ogawa, and Rikiya Matsukura, “Trends of Population Aging in East and Southeast Asia: The 2022 Update,” BioScience Trends 16, no. 2, 2022, pp. 85–97.
[63] Observer Research Foundation, “China’s Belt and Road Initiative in a Changing World.”
[64] Hu, “Development of STEM Education in China.”
[65] Observer Research Foundation, “China’s Belt and Road Initiative in a Changing World;” Wang, Shen, and Cai, “When the Abundance Ends,” p. 30.
Disclaimer
The views expressed in this paper are solely those of the author and do not reflect the opinions of the editors or the journal.